目录
- PyVista简介
- PyVista是什么
- pyvista和其他3D可视化工具比较
- pyvista使用
- mesh彩色映射
- 使用pyvista自带的cmp
- 使用Matplotlib的cmp
- 使用colorcet的cmp
- 总结
最近项目中需要对mesh做一个色彩映射,无意间发现vtk的封装库pyvista相当好用,就试了试,在此做一个总结。
PyVista简介
PyVista是什么
PyVista 是一个:
- VTK for humans”, 可视化工具包(VTK)的高级API
- 空间数据的网格数据结构与滤波方法
- 使3D绘图更加简单,可用于大型/复杂数据的图像化
PyVista(以前的vtki)是可视化工具包(VTK)的一个助手模块,它采用了一种不同的方法,通过NumPy和直接数组访问与VTK进行接口。这个包提供了一个python化的、文档化良好的接口,展示了VTK强大的可视化后端,以方便对空间引用的数据集进行快速原型化、分析和可视化集成。
该模块可用于演示文稿和研究论文的科学绘图,以及其他依赖网格的Python模块的支持模块。
参考:https://docs.pyvista.org/index.html
github
官方教程
pyvista和其他3D可视化工具比较
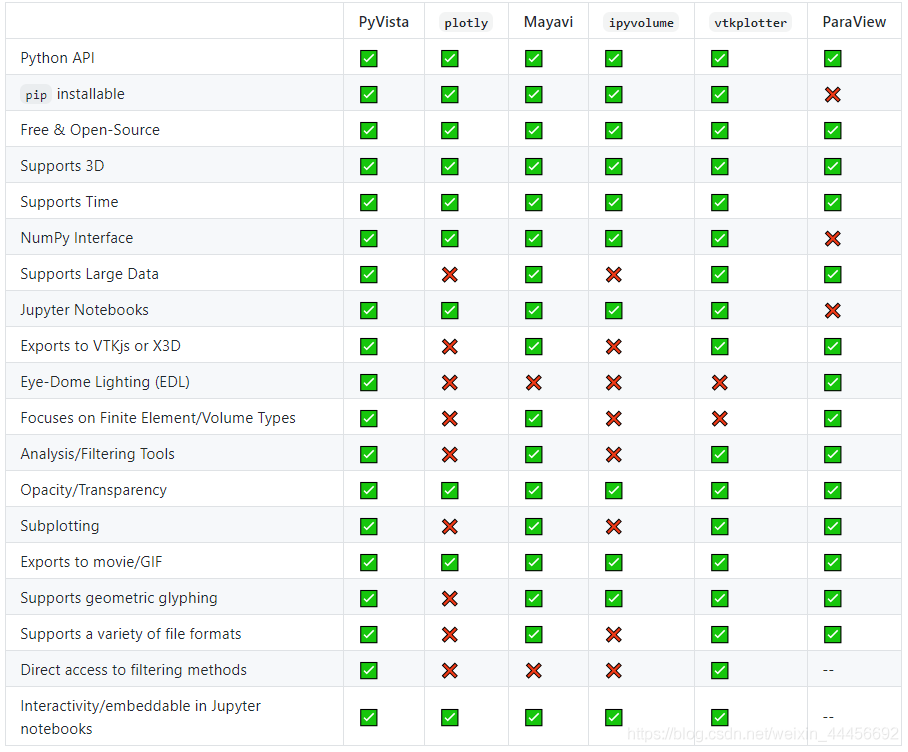
参考:https://github.com/pyvista/pyvista/issues/146
pyvista使用
安装
pip install pyvista -i https://pypi.tuna.tsinghua.edu.cn/simple
I/O读取及可视化
mesh类型
pyvista支持读取大多数常见的mesh文件类型,比如PLY,VTK,STL ,OBJ ,BYU 等,一些不常见的mesh文件类型,比如FEniCS/Dolfin_ XML format
(很遗憾,pyvista不支持点云PCD格式,不过可以通过pcdpy、pclpy、python-pcl等库来读取pcd文件)
import pyvista as pv
# 读取
mesh = pv.read('pointCloudData/data.vtk')
# 显示
mesh.plot()
# 其他类似
mesh = pv.read('pointCloudData/data.ply')
……
图片类型
支持读取图片类型数据JPEG, TIFF, PNG等
# 读取
image = pv.read('my_image.jpg')
# 显示
image.plot(rgb=True, cpos="xy")

# 其余图片类型类似
……
mesh彩色映射
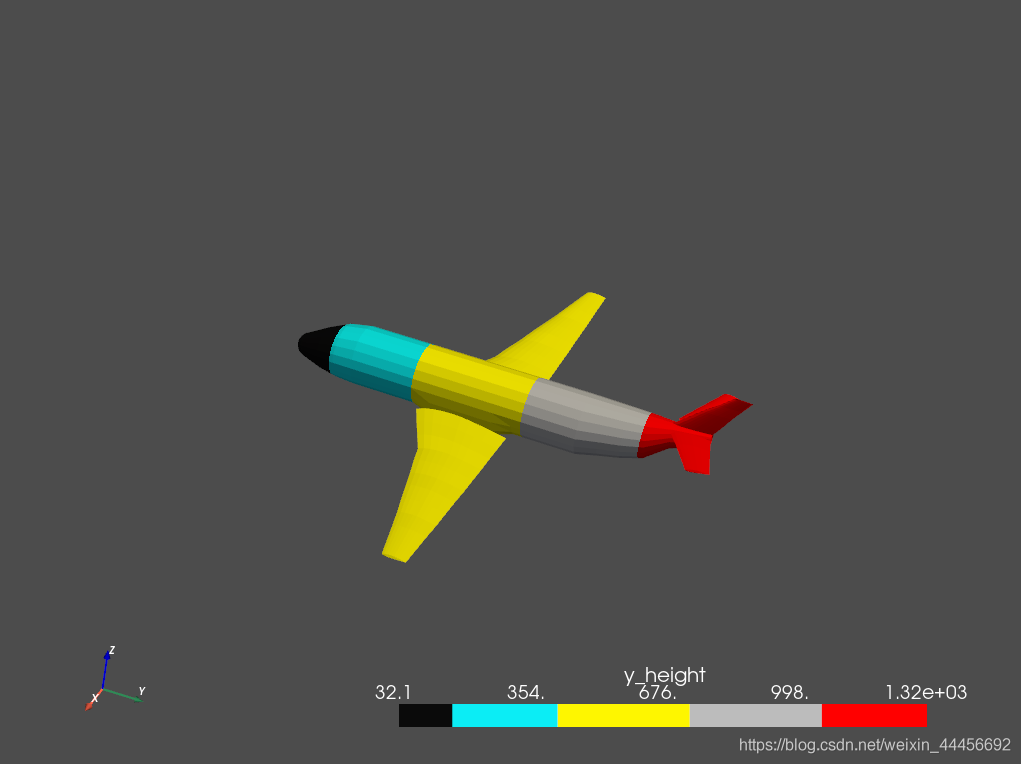
项目中需要用到根据高度来对mesh进行彩色映射,在pyvista中大概有四种方法
自定义
代码
import pyvista as pv
import matplotlib.pyplot as plt
from matplotlib.colors import ListedColormap
import numpy as np

def mesh_cmp_custom(mesh, name):
 """
 自定义色彩映射
 :param mesh: 输入mesh
 :param name: 比较数据的名字
 :return:
 """
 pts = mesh.points
 mesh[name] = pts[:, 1]
 # Define the colors we want to use
 blue = np.array([12 / 256, 238 / 256, 246 / 256, 1])
 black = np.array([11 / 256, 11 / 256, 11 / 256, 1])
 grey = np.array([189 / 256, 189 / 256, 189 / 256, 1])
 yellow = np.array([255 / 256, 247 / 256, 0 / 256, 1])
 red = np.array([1, 0, 0, 1])

 c_min = mesh[name].min()
 c_max = mesh[name].max()
 c_scale = c_max - c_min

 mapping = np.linspace(c_min, c_max, 256)
 newcolors = np.empty((256, 4))
 newcolors[mapping >= (c_scale * 0.8 + c_min)] = red
 newcolors[mapping  (c_scale * 0.8 + c_min)] = grey
 newcolors[mapping  (c_scale * 0.55 + c_min)] = yellow
 newcolors[mapping  (c_scale * 0.3 + c_min)] = blue
 newcolors[mapping  (c_scale * 0.1 + c_min)] = black

 # Make the colormap from the listed colors
 my_colormap = ListedColormap(newcolors)
 mesh.plot(scalars=name, cmap=my_colormap)

if __name__ == '__main__':
 mesh = pv.read('pointCloudData/1.ply')
 mesh_cmp_custom(mesh, 'y_height')
效果:
使用pyvista自带的cmp
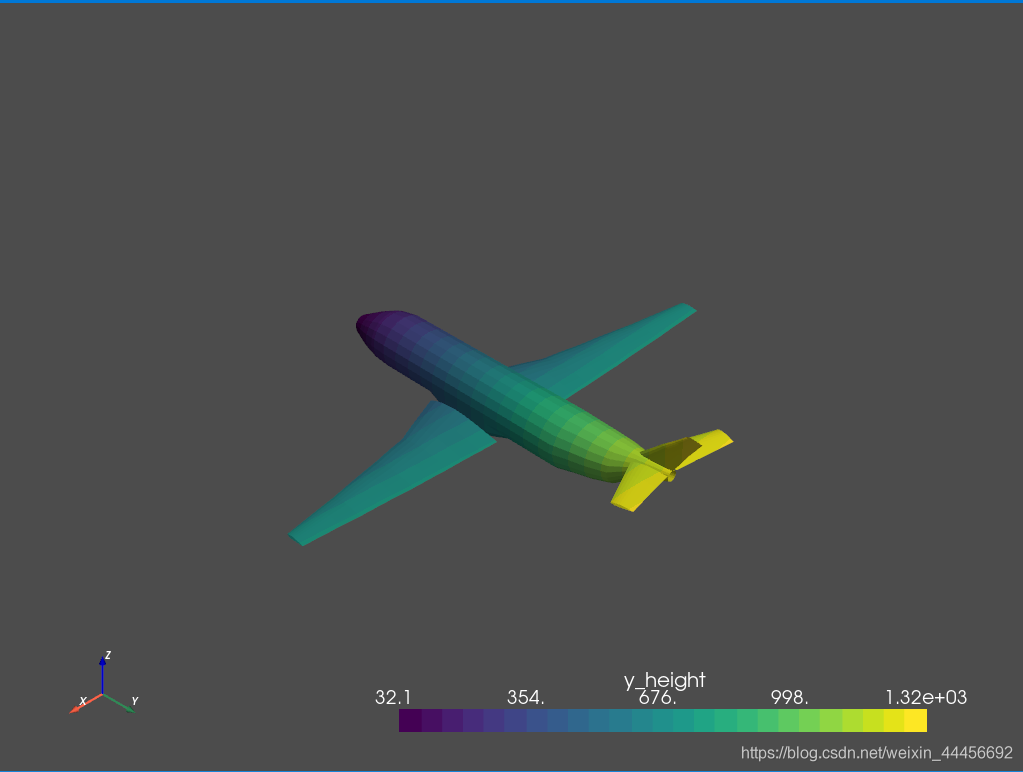
函数mesh.plot(scalars=name, cmap='viridis_r')
其中cmap支持的样式:
‘Accent', ‘Accent_r', ‘Blues', ‘Blues_r', ‘BrBG', ‘BrBG_r', ‘BuGn', ‘BuGn_r', ‘BuPu', ‘BuPu_r', ‘CMRmap', ‘CMRmap_r', ‘Dark2', ‘Dark2_r', ‘GnBu', ‘GnBu_r', ‘Greens', ‘Greens_r', ‘Greys', ‘Greys_r', ‘OrRd', ‘OrRd_r', ‘Oranges', ‘Oranges_r', ‘PRGn', ‘PRGn_r', ‘Paired', ‘Paired_r', ‘Pastel1', ‘Pastel1_r', ‘Pastel2', ‘Pastel2_r', ‘PiYG', ‘PiYG_r', ‘PuBu', ‘PuBuGn', ‘PuBuGn_r', ‘PuBu_r', ‘PuOr', ‘PuOr_r', ‘PuRd', ‘PuRd_r', ‘Purples', ‘Purples_r', ‘RdBu', ‘RdBu_r', ‘RdGy', ‘RdGy_r', ‘RdPu', ‘RdPu_r', ‘RdYlBu', ‘RdYlBu_r', ‘RdYlGn', ‘RdYlGn_r', ‘Reds', ‘Reds_r', ‘Set1', ‘Set1_r', ‘Set2', ‘Set2_r', ‘Set3', ‘Set3_r', ‘Spectral', ‘Spectral_r', ‘Wistia', ‘Wistia_r', ‘YlGn', ‘YlGnBu', ‘YlGnBu_r', ‘YlGn_r', ‘YlOrBr', ‘YlOrBr_r', ‘YlOrRd', ‘YlOrRd_r', ‘afmhot', ‘afmhot_r', ‘autumn', ‘autumn_r', ‘binary', ‘binary_r', ‘bone', ‘bone_r', ‘brg', ‘brg_r', ‘bwr', ‘bwr_r', ‘cividis', ‘cividis_r', ‘cool', ‘cool_r', ‘coolwarm', ‘coolwarm_r', ‘copper', ‘copper_r', ‘cubehelix', ‘cubehelix_r', ‘flag', ‘flag_r', ‘gist_earth', ‘gist_earth_r', ‘gist_gray', ‘gist_gray_r', ‘gist_heat', ‘gist_heat_r', ‘gist_ncar', ‘gist_ncar_r', ‘gist_rainbow', ‘gist_rainbow_r', ‘gist_stern', ‘gist_stern_r', ‘gist_yarg', ‘gist_yarg_r', ‘gnuplot', ‘gnuplot2', ‘gnuplot2_r', ‘gnuplot_r', ‘gray', ‘gray_r', ‘hot', ‘hot_r', ‘hsv', ‘hsv_r', ‘inferno', ‘inferno_r', ‘jet', ‘jet_r', ‘magma', ‘magma_r', ‘nipy_spectral', ‘nipy_spectral_r', ‘ocean', ‘ocean_r', ‘pink', ‘pink_r', ‘plasma', ‘plasma_r', ‘prism', ‘prism_r', ‘rainbow', ‘rainbow_r', ‘seismic', ‘seismic_r', ‘spring', ‘spring_r', ‘summer', ‘summer_r', ‘tab10', ‘tab10_r', ‘tab20', ‘tab20_r', ‘tab20b', ‘tab20b_r', ‘tab20c', ‘tab20c_r', ‘terrain', ‘terrain_r', ‘turbo', ‘turbo_r', ‘twilight', ‘twilight_r', ‘twilight_shifted', ‘twilight_shifted_r', ‘viridis', ‘viridis_r', ‘winter', ‘winter_r'
代码
import pyvista as pv
def mesh_cmp(mesh, name):
 """
  使用进行plot自带的色彩映射
  :param mesh: 输入mesh
  :param name: 比较数据的名字
  :return:
 """
 pts = mesh.points
 mesh[name] = pts[:, 1]
 mesh.plot(scalars=name, cmap='viridis_r')

if __name__ == '__main__':
 mesh = pv.read('vtkData/airplane.ply')
 mesh_cmp(mesh, 'y_height')
效果
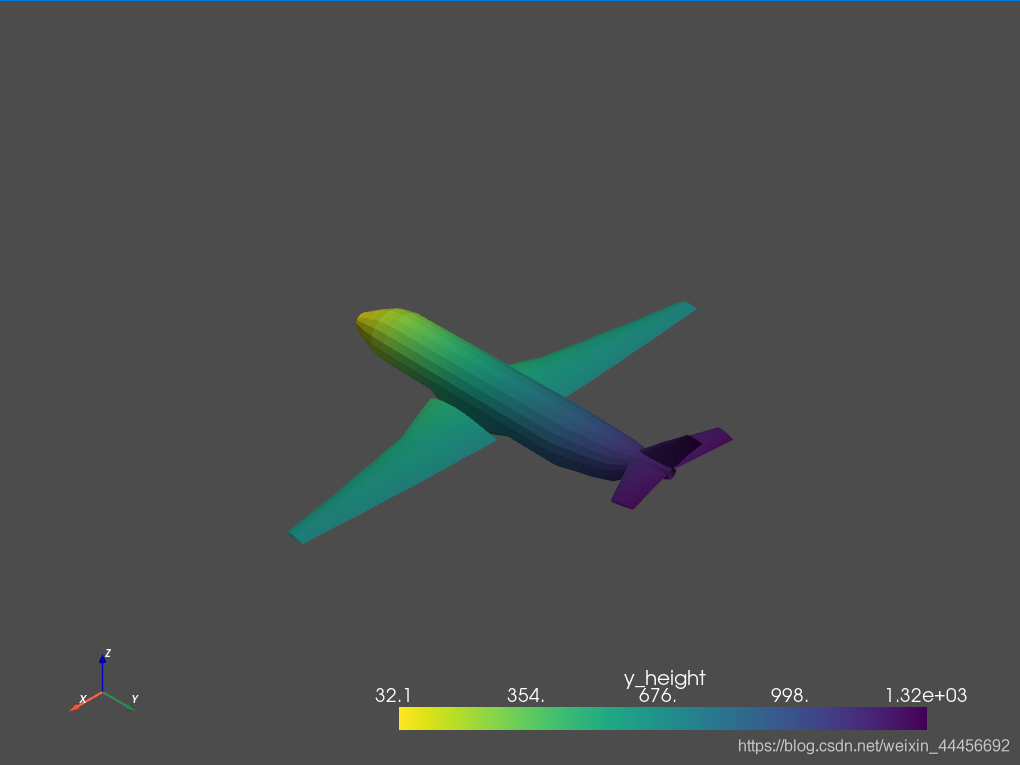
使用Matplotlib的cmp
代码
import pyvista as pv
import matplotlib.pyplot as plt

def mesh_cmp_mpl(mesh, name):
 """
  使用Matplotlib进行色彩映射
  :param mesh: 输入mesh
  :param name: 比较数据的名字
  :return:
  """
 pts = mesh.points
 mesh[name] = pts[:, 1]
 mlp_cmap = plt.cm.get_cmap("viridis", 25)
 mesh.plot(scalars=name, cmap=mlp_cmap)

if __name__ == '__main__':
 mesh = pv.read('vtkData/airplane.ply')
 mesh_cmp_mpl(mesh, 'y_height')
效果
使用colorcet的cmp
需要先安装colorcet:
使用方法和上面几种方法类似,若想使用colorcet的colormaps中的hot:
mesh.plot(scalars=name, cmap=“hot”)
代码
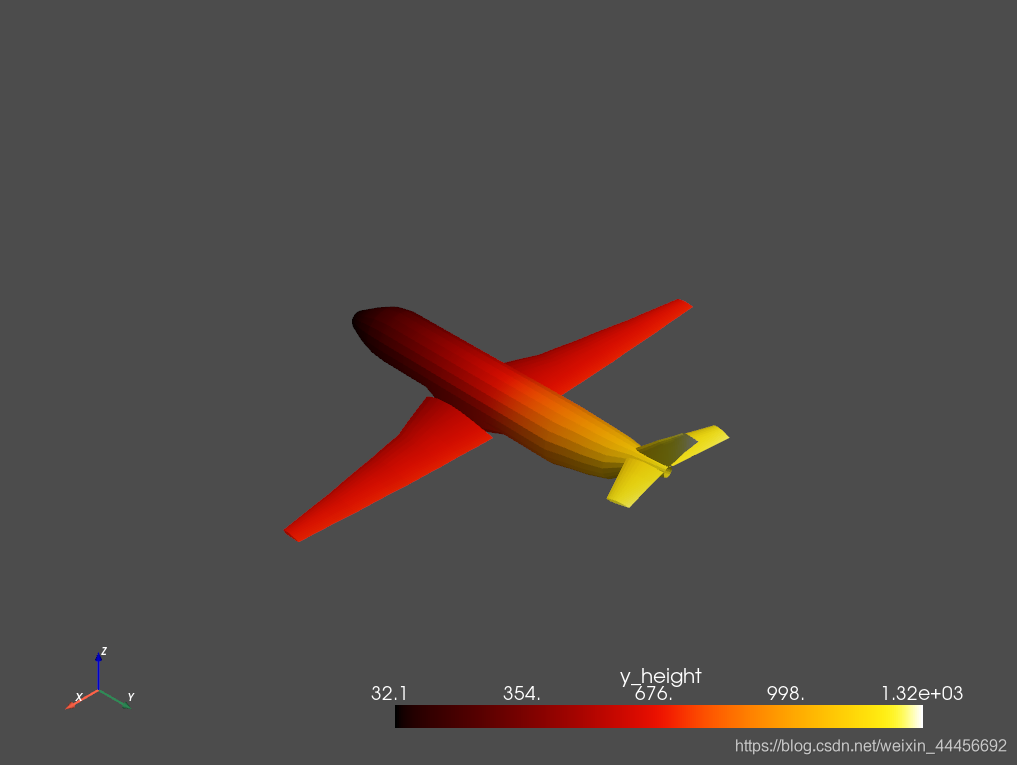
def mesh_cmp_colorcet(mesh, name):
 """
  使用进行colorcet进行色彩映射
  :param mesh: 输入mesh
  :param name: 比较数据的名字
  :return:
 """
 pts = mesh.points
 mesh[name] = pts[:, 1]
 mesh.plot(scalars=name, cmap=colorcet.fire)

if __name__ == '__main__':
 mesh = pv.read('vtkData/airplane.ply')
 mesh_cmp_colorcet(mesh, 'y_height')
效果:
总结
pyvista相当强大,而且比直接用vtk更加方便(代码量肉眼可见的降低!)
到此这篇关于Python利用PyVista进行mesh的色彩映射的实现的文章就介绍到这了,更多相关PyVista mesh色彩映射内容请搜索脚本之家以前的文章或继续浏览下面的相关文章希望大家以后多多支持脚本之家!
您可能感兴趣的文章:- Python ORM框架SQLAlchemy学习笔记之关系映射实例
- Python简单实现的代理服务器端口映射功能示例
- 详解python-图像处理(映射变换)
- python 实现12bit灰度图像映射到8bit显示的方法
- Python映射拆分操作符用法实例